

A new online tool has launched today that Britons can use to see how the price of their home has increased, taking into account inflation, when compared to items such as a pint of beer, Freddos, petrol and even Glastonbury Tickets, leading to an inflation nation.
House prices continue to increase year on year making it difficult for younger generations to get their foot on the property ladder. Corresponding with this, whilst smaller purchases have fluctuated over the last 40 years, they too have generally increased meaning Britons are having to spend more money than ever before.
‘The Property vs Purchase Calculator’ created by the team at www.Hillarys.co.uk, compares the inflation of house prices in each region to smaller purchases such as a pint of beer, Freddos and petrol, from 1973 onwards. 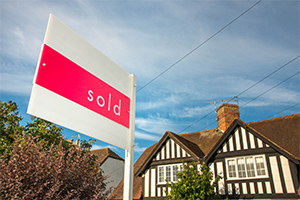
Users are able to choose the region they live in and the item they are interested in seeing the price fluctuation of over the past 40 years. The results are then displayed in a graph, comparing how inflation has affected the average home price in the selected region to the item chosen.
For example, when looking at the average house price for the whole of the UK, the graph demonstrates that Glastonbury ticket prices have in fact risen higher since 1979, by a mammoth 4860%, than house prices which have seen a 1,186% increase.
If the user were to select Freddos to compare to property prices in the North East, they would see that the much loved chocolate bar has seen a 200% increase over the years compared to house prices in this area, which increased by 182%.
Finally, if they were to compare London house prices against a pint of beer, in 1973 house prices averaged £12,848 and a pint would cost 19p. By 2000, house prices increased to £140,148 and pint prices to £2.00 and, just nine years later, supply and demand, paired with inflation rates have seen house prices skyrocket to £457,000 (a 3,457% increase since 1973) and pint costs to £3.37 (a 1,674% increase since 1973).
The graph can be shown in a column or line chart, with house prices represented in yellow and the item chosen to compare signified in blue. The graph also displays how the pound has fluctuated over the years, shown in pink to make differences apparent.
Lucy Askew, spokesperson for www.hillarys.co.uk, commented:
“It is amazing to see how cheap items were back in the day and as the price of houses and everyday items go up, so does the value of the pound. However it’s definitely interesting to see that the pound’s value hasn’t increased more over time than the smaller items and the cost of homes.”
- Log in to post comments